
What a difference a year can make. Last April, we were discussing the uncertainty and unprecedented events of the early pandemic. The daily headlines seemed to rotate between record unemployment claims, increasing infection rates, a locked down economy, and a wildly volatile stock market. In contrast, our attention today is focused on millions of new jobs being added to payrolls, ever-higher vaccination rates, an economy that is opening up, and one of the strongest one-year stock market returns that most investors have ever experienced.
Much of the credit for allowing us to celebrate so many positives in such a relatively short period of time is due to the diligence and commitment of frontline workers who helped keep the economy functioning when things were at their worst and the scientists and medical professionals who have taken us from uncertainty around an unknown disease to now over 125 million people having received at least one dose of a COVID-19 vaccine in the U.S. 1
Market Gains
In his recent post, One Year Ago Today, CCM Senior Investment Strategist James Yaworski, CFA, discusses the journey and incredible gains that have been experienced by stock investors since the lows of March 2020, and what may be expected on the horizon for stock returns. To further extend the conversation, the table on the left shows the remarkable performance of the U.S. stock market, as broken down by the asset classes of the Morningstar 9-style box. With our portfolios focusing more on the lower left-hand boxes around small and value stocks than the market as a whole, CCM clients have been able to capture more upside in the recovery.
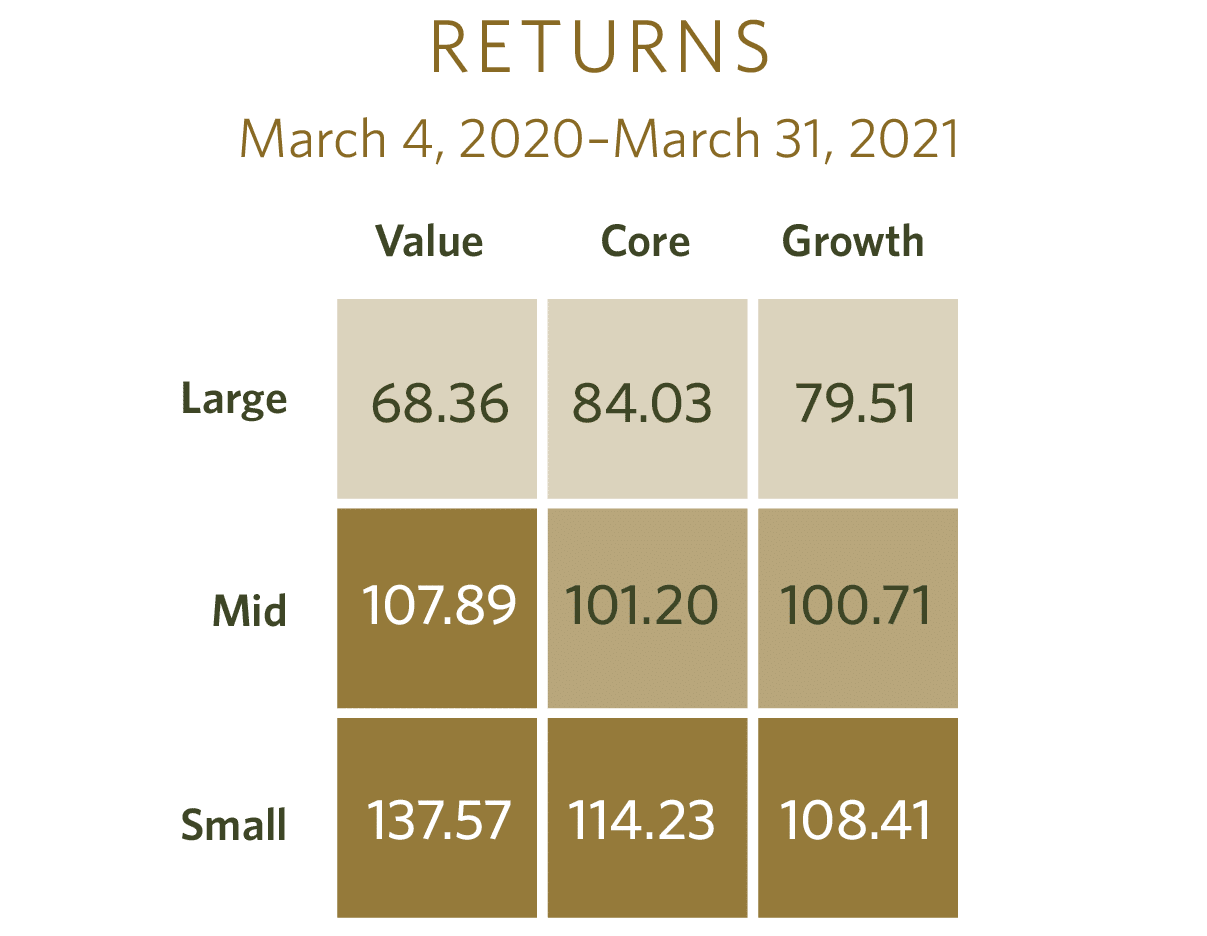
It’s worth repeating that, regardless of how good the numbers in any chart seem to be, the only way to capture market returns is to stay disciplined and stay invested. So, although we don’t fully know what’s to come, take a moment to celebrate your commitment to your financial plan and pat yourself on the back for capturing these returns.
The Role of Bonds
While stocks are the main driver of growth within most investment portfolios and garner the majority of our attention as investors, bonds and fixed income instruments are very key components to most successful long-term outcomes. After all, it was due to the relative stability of bonds that we were able to be net buyers of stocks at their lows in 2020. It was also the stability of high-quality bonds that provided a source for cashflow needs last March without having to accept the prices of equity assets that were experiencing a 35% drawdown.
The relative stability of bonds compared to stocks has to do with the nature of the bond assets. While stocks are ownership claims on the uncertain future profits or losses of a company, bonds are essentially loans that have stated terms for interest to be received and a timeline in which the principal investment will be repaid. And although there can be price fluctuations in bonds over time, they are typically far less volatile than stocks. Assuming a bond issuer (government, corporation, etc.) doesn’t default on the debt, the investor will be made whole at maturity.
An Introduction to Yield Curves
When we evaluate bonds, we need to understand both the credit quality of the issuer and how long into the future the maturity of the bond falls. When looking at bonds of the same quality, like Treasuries issued by the U.S. government, the mapping of the expected returns, or yields, is called a yield curve. Most often, yield curves are upwardly sloping, with shorter-term bonds paying lower levels of interest than longer-term bonds. This is usually a compensation for the additional risk of the possibility of adverse events occurring over a longer time horizon. This is why 15-year mortgage rates are typically lower than 30-year rates—the lender requires greater compensation for the risk inherent to the longer-term period.
When we experience an upwardly sloped curve, like we have now, we also must measure how steep the curve is as we extend farther out to longer maturities. This measurement is called a spread and is calculated by taking the longer-dated yield and subtracting a shorter-dated yield. For example, looking at the March 31, 2021, Treasury curve below, we see that a 10-year bond was yielding 1.74%, while a 30-day bond was only yielding 0.01%. 2 Therefore, the spread is 1.73%. The higher the spread, the greater the benefit for extending the maturity of bonds within the portfolio.
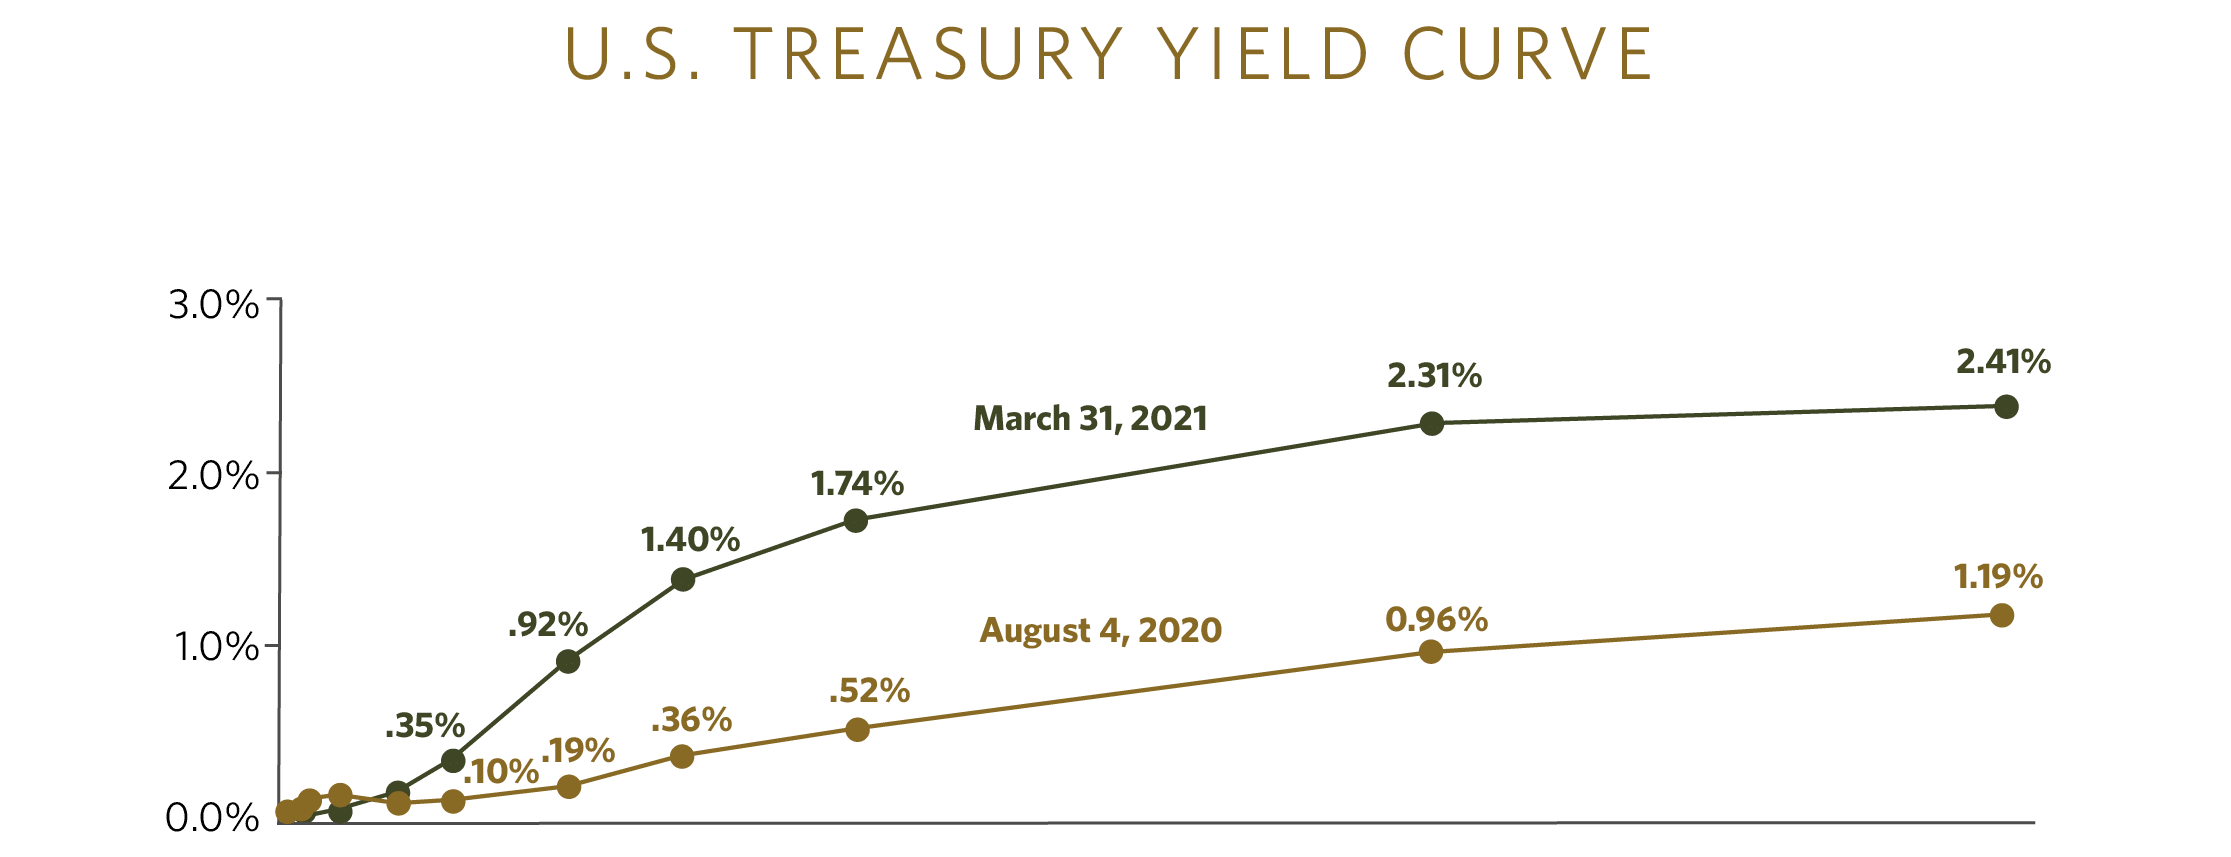
Although current yields are relatively low compared to historical levels, they are significantly higher than they were just a few months ago. Additionally, the spread between the 10-year and 30-day bonds is the highest it’s been in over four years. 3 Therefore, it’s starting to make sense to extend farther out in the maturity of a portion of our bond portfolios to capture the more attractive yields.
How CCM Leverages Yield Curves
This type of proactive management of utilizing the information found in the yield curve and relative spreads to target bonds of certain characteristics has been a part of our fixed-income strategy for nearly 20 years. Although it may sound counterintuitive as longer-term bonds tend to have greater price fluctuations than shorter-term bonds, by extending maturities in the portfolio and owning longer term bonds when they are attractively priced, the effect can be higher total portfolio returns while also dampening total portfolio volatility. This effect is due to bonds often behaving very differently than stocks in times of crisis. One zigs, while the other zags.
In the past, the shifting of targeted maturities has traditionally happened within the mutual funds themselves. With additional research that CCM has conducted, and with products and technology available to do so effectively, we will soon begin to manage the maturity exposure of your fixed-income portfolios outside of some of our traditional holdings and will be using targeted index funds and, in some cases, individual bonds to optimize your financial goals.
As with all portfolio management that we execute for our clients, any potential changes will be evaluated at the level of your specific portfolio and through the lens of your specific financial plan. In some instances, we may not make a shift because of existing legacy holdings. In others, there may be tax considerations that will restrict a reallocation. We will always take action in a way that keeps your specific best interests at the center.
- April 14, 2021: https://covid.cdc.gov/covid-data-tracker/#vaccinations
- https://www.treasury.gov/resource-center/data-chart-center/interest-rates/pages/TextView.aspx?data=yieldYear&year=2021
- https://fred.stlouisfed.org/series/T10Y3M
NOTE: The information provided in this article is intended for clients of Carlson Capital Management. We recommend that individuals consult with a professional adviser familiar with their particular situation for advice concerning specific investment, accounting, tax, and legal matters before taking any action.