
Although much of the Minnesota landscape is currently covered in a fresh blanket of snow, rearranging the order of the oft-quoted springtime idiom more aptly describes the first quarter behavior of equity markets than it does the weather. It was once again a reminder that the animal spirits of markets don’t always follow the seasons.
The year began where 2017 left off, with global stock markets carrying their strong positive momentum into the new year. In fact, the S&P 500 index hit 10 new all-time closing highs in the first 13 trading days alone. Unfortunately, the upward trend wouldn’t be sustained through the quarter, and a true market correction (>10% decline) set in during February. A sharp spike in volatility, political posturing over the Korean peninsula, continued concerns about free and fair elections, the privacy of data shared on social media, and a possible trade war incited by newly signed tariffs dominated the headlines, with each playing a part in our collective experience.
One group of companies for which volatility gnashed its metaphoric teeth were the tech giants. Known as the FAANG stocks (perhaps an apt acronym this past quarter), Facebook, Amazon, Apple, Netflix, and Google (Alphabet Inc. stock) all finished March significantly off their intra-quarter highs. With concerns over privacy of user data and possible increased scrutiny and regulation, Facebook stock pulled back the most out of the group (and more than twice as much as the NASDAQ 100 index) by losing more than 21% of its value between February 2 and March 27.1
I don’t highlight this point as commentary on the business practices, leadership, or future growth trajectory of Facebook; it simply serves as a reminder that investing in individual companies carries individualized risks.
With the knowledge that diversification tightens the range of returns around what has been a very positive long-term return for stocks, and that it can dramatically reduce the volatility one experiences along the way, why would anyone do differently?
To illustrate this point, the chart below plots each of the 30 companies currently in the Dow Jones Industrial Average (DJIA) by their 10-year risk (x-axis) and return (y-axis).We’ve also included the collective risk and return of the index that would have simply owned all the stocks for the past ten years (see chart, gold dot).
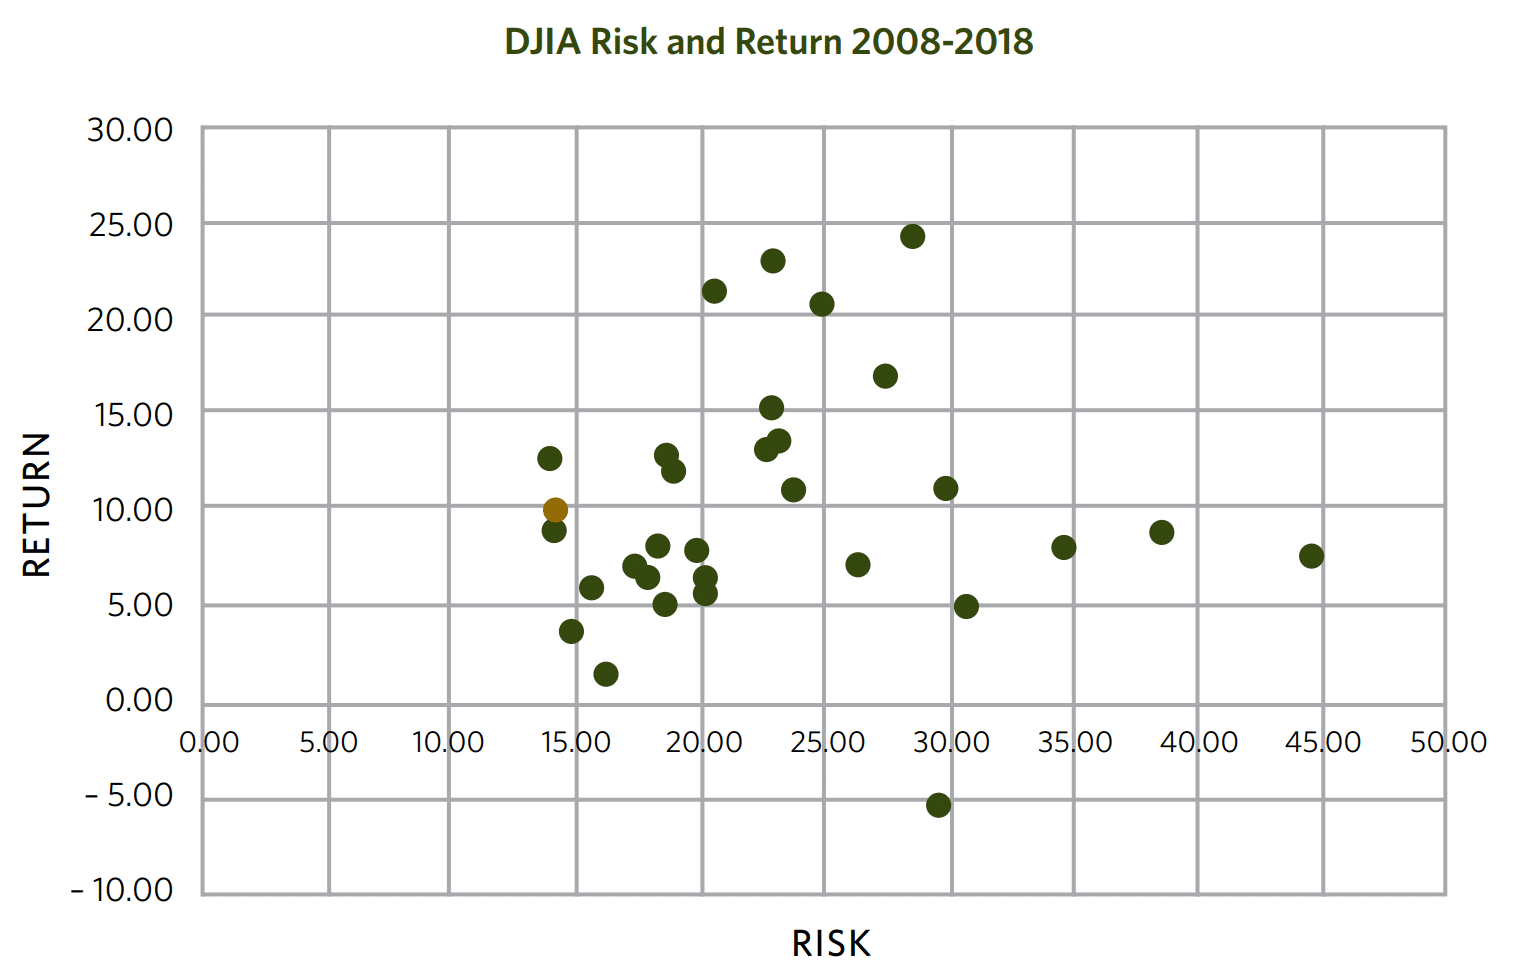
By owning everything, you are knowingly trading the possibility of investing in the best to avoid the worst. Owning everything (the gold dot) smooths out the ride, as shown by the low volatility of the index return relative to the 30 stocks within the DJIA. Capturing the average return without the average volatility results in a better experience for investors.
In our portfolios at Carlson Capital Management, we take stock diversification even further. By adding more “dots” to a portfolio that each individually contain hundreds or thousands of stocks of different sizes (known as large & small), relative prices (value & growth), and high relative profitability from around the world, we strive to push returns higher and risk lower. And for many of you, when we add in a layer of much safer and non-correlated fixed income to the mix, we make a dramatic shift in how the portfolio dots plot on the grid, creating a more diversified and less volatile portfolio.
Another important point to understand when reflecting on the past three months is that with the return of significant volatility after such a stretch of stability (the first quarter posted the first quarterly loss in the S&P 500 index since October of 2015) there could likely be a desire to apply a narrative to our collective experience as investors which may or may not align with reality. During this long stretch of growth, some investors seem to have focused more on the anxiety of each new market high (72 since January of 2017!), as opposed to focusing on how these highs were helping them achieve their financial goals.2 When you think something may happen, even if it takes years to materialize, when and if it does happen, it may seem like it was an easily predictable outcome.
Imagine that an investor went to cash at the first of those 72 market highs, in anticipation of a correction. The question is, would they have the prescient timing to get back in now? Although down, the S&P 500 ended March at levels it was last at only a few months earlier.3 So when the next all-time high comes, it’s important to remember the following even as markets grow (or contract):
- Every day, stocks have a positive expected return regardless of whether markets are at an all-time high or not.
- While expected returns are always positive, positive realized returns are never guaranteed and may deviate from expectations.
The reason we can expect positive returns, regardless of the current market level, is attributable to how markets set prices. Stock prices are the result of the interaction of many willing buyers and sellers. Current prices reflect the value of future cash flows expected by those buyers and sellers to be received from the stock. But, because there is uncertainty around these future cash flows and time has to pass in order to receive them; and because investors bear the risk of potential losses if they don’t materialize, these cash flows are “discounted” based on a shareholder’s desire to hold that risk. If the buyers of a stock view the future cash flows as more uncertain, they will likely want to pay a lower price for the stock. They will only transact when the price reaches a level where they expect to earn a positive return. For these reasons, we expect stock market prices to be set to a level at which the required rate of return for investing in stocks is positive, whether the market is at a new high, a new low, or something in between. Otherwise, why would buyers in the marketplace willingly transact at a given price?
The question of whether new market highs imply an impending fall in stock prices can often be translated to another, more general question: “Is now a good time for me to be invested?” The evidence suggests that the current state of the market is not helpful in answering this question. Rather, an appropriate answer is highly dependent upon an investor’s unique situation and their risk and return objectives. For investors deciding stock market exposure is appropriate, in our opinion, a disciplined approach with a long-term view is a more prudent course of action than reacting to new market highs.
- 1. https://www.nasdaq.com/symbol/fb
- S&P 500 Index data © 2018 Dow Jones Indices LLC.
- The S&P 500 TR closed lower on 12/14/2017 than it did on 3/30/2018. Source: S&P 500 Index data © 2018 Dow Jones Indices LLC.
NOTE: The information provided in this article is intended for clients of Carlson Capital Management. We recommend that individuals consult with a professional adviser familiar with their particular situation for advice concerning specific investment, accounting, tax, and legal matters before taking any action.