
During our recent client event presentation at the Minnesota History Center, we discussed the importance of asking good questions. In a world in which most of us carry around small computers in our pockets that are capable of tapping into a seemingly infinite pool of data and information that is the internet, the value of the answers we find corresponds directly with the quality of the questions we ask. When exploring answers for many commonly asked financial questions, the risk that one faces is that the difference between good and bad questions can lead to either success or failure in meeting long-term goals.
One of the often-asked questions we explored at the event was, “How have markets performed?” To answer this question in the context of the past quarter—the past three months brought another very strong period for stocks in markets across the globe. In fact, returns were so robust that the S&P 500 Index closed daily trading at a new all-time high 17 times since June. While this is clearly something to celebrate and view positively, it’s not uncommon for reports of new all-time highs to be met with some level of anxiety about some unknown future downturn. There is no shortage of ‘answers’ to be found and no shortage of talking heads shouting about the imminent end of the current bull market. What’s important to realize is that many of these same sources have been repeating doom and gloom messages for years all the while there have been 229 new all-time highs reached in U.S. stocks. While we know capital markets do not always go up, fearing such growth is typically counter-productive. Confusing the inevitability of events like market downturns with their imminence can lead you far from the path of success.
What we need to remember is that a quarter, a year, or even a decade doesn’t tell the full story of why or how to invest. Reaching all-time highs shouldn’t drastically change how a portfolio is structured if personal goals have not changed as well. Capital markets have rewarded investors over the long term, and having an investment approach you can stick with—especially during tough times—may better prepare you for the next crisis and its aftermath.
In 2008, the stock market dropped in value by almost half. Being a decade removed from the crisis may make it easier to take the past in stride. The eventual rebound and subsequent years of double-digit gains have also likely helped in this regard. While the events of the crisis were unfolding, however, a future of this sort looked anything but certain. Headlines such as “Worst Crisis Since ’30s,With No End Yet in Sight,” “Markets in Disarray as Lending Locks Up,” and “For Stocks, Worst Single-Day Drop in Two Decades,” were common front page stories. Reading the news, opening quarterly statements, or going online to check an account balance were, for many, stomach-churning experiences.
While being an investor today (or during any period, for that matter), is by no means a worry-free experience, the feelings of panic and dread felt by many during the financial crisis were distinctly acute. Many investors reacted emotionally to these developments. In the heat of the moment, some decided it was more than they could stomach, so they sold out of stocks. On the other hand, many who were able to stay the course and stick to their approach recovered from the crisis and benefited from the subsequent rebound in markets.
It is important to remember that this crisis and the subsequent recovery in financial markets was not the first time in history that periods of substantial volatility have occurred. The chart below, “The Market’s Response to Crisis,” helps illustrate this point. The illustration shows the performance of a balanced investment strategy following several crises, including the bankruptcy of Lehman Brothers in September of 2008, which took place in the middle of the financial crisis. Each event is labeled with the month and year that it occurred or peaked.
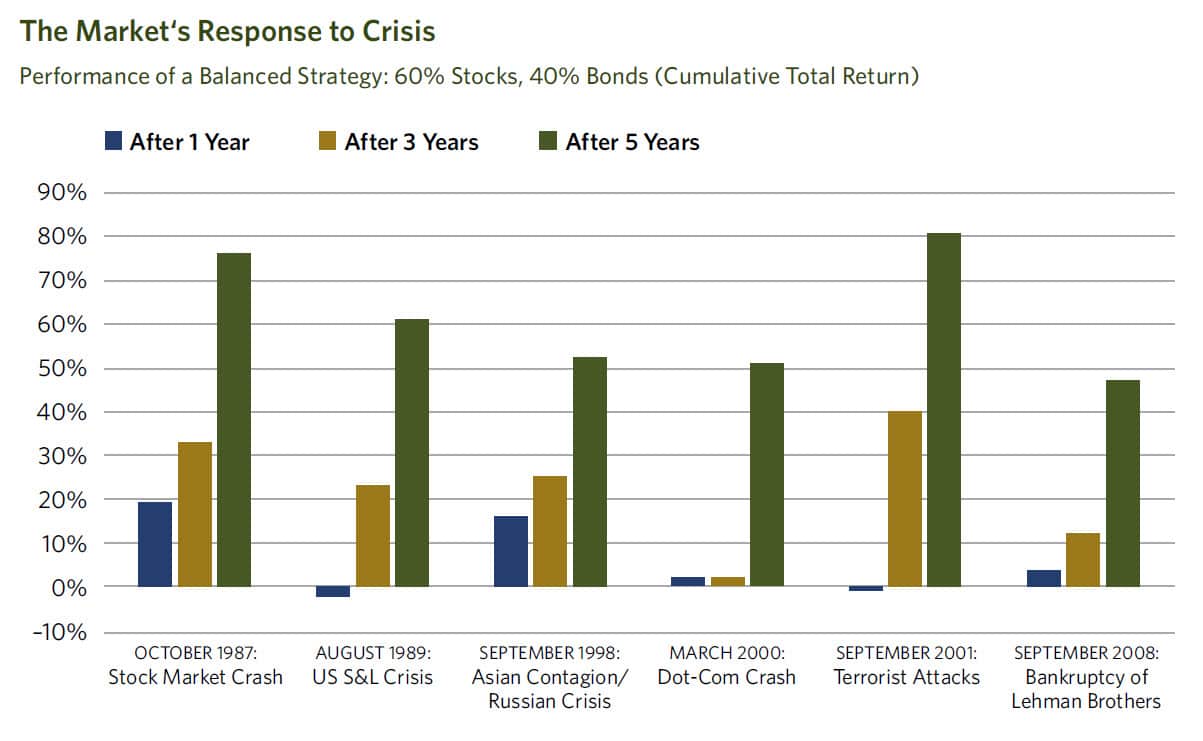
Although a globally diversified balanced investment strategy invested at the time of each event would have suffered losses immediately following most of these events, financial markets did recover, as can be seen by the three- and five-year cumulative returns shown in the chart. In advance of such periods of discomfort, having a long-term perspective, appropriate diversification, and an asset allocation that aligns with their risk tolerance and goals can help investors remain disciplined enough to ride out the storm. A financial advisor can play a critical role in helping to work through these issues and in counseling investors when things look their darkest.
In the minds of some investors, there is always a “crisis of the day” or potential major event looming that could mean the beginning of the next drop in markets. As we know, predicting future events correctly, or how the market will react to future events, is a difficult exercise. Thinking about the post global financial crisis recovery and the strength of equity markets to generate wealth and provide the engine for the long-term success of whatever your financial goals may be, and thinking about the challenges and stress inducing headlines that have been published in the past five years, how many of the 229 new all-time highs would you have missed if you reacted emotionally to the news instead of through a disciplined rebalancing strategy?
It is important to understand, however, that market volatility is a part of investing. To enjoy the benefit of higher potential returns, investors must be willing to accept increased uncertainty. A key part of a good long-term investment experience is being able to stay with your investment philosophy, even during tough times. A well-thought-out, transparent investment approach is what we focus on at CCM, and can help you be better prepared to face uncertainty. This will likely improve your ability to stick with your overall plan and ultimately capture the long-term returns of capital markets.
NOTE: The information provided in this article is intended for clients of Carlson Capital Management. We recommend that individuals consult with a professional adviser familiar with their particular situation for advice concerning specific investment, accounting, tax, and legal matters before taking any action.