
One of the foundational underpinnings of our investment approach at CCM is the simple premise that “costs matter.” Over the last 30 years, the internal and execution costs of how we manage portfolios has dropped significantly. This has resulted in savings of hundreds of thousands of dollars for our clients. We are diligent in our analysis of costs relative to the value received by our clients.
When investing in mutual funds, the costs of ownership matter. Importantly, these costs need to be measured relative to the value received—which is most commonly evaluated through the lens of the underlying performance of the fund. Mutual funds carry many costs, all of which affect net return to investors. One easily observable cost is a fund’s expense ratio. Expense ratios strongly influence fund selection for many investors, and it’s easy to see why.
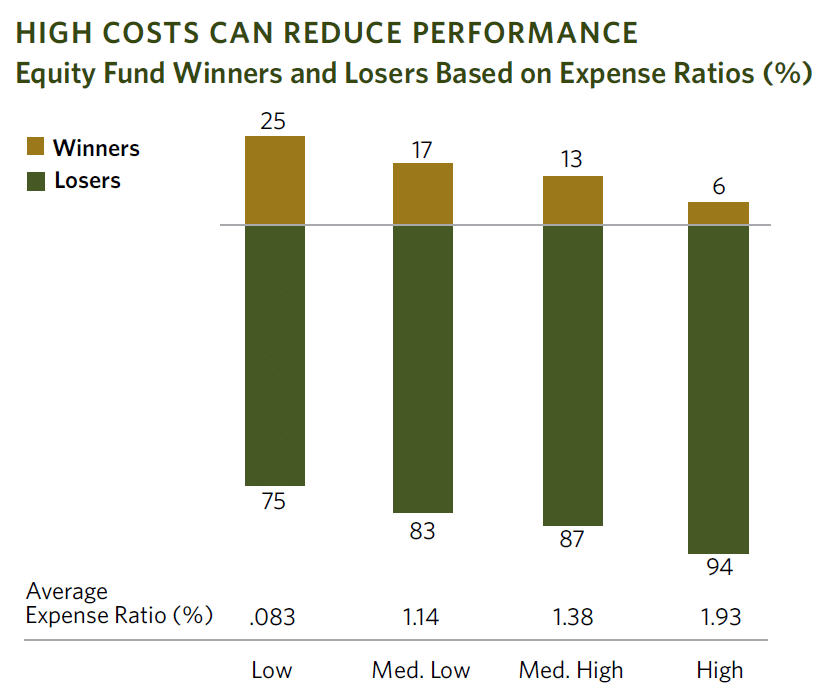
The chart below illustrates the out-performance rate—or the percentage of funds that beat their category index—for active equity mutual funds over the 15-year period ending December 31, 2017. As the chart shows, while active funds have mostly lagged indices across the board, the out-performance rate has been greatest for high expense funds. Just 6% of funds in the highest expense ratio quartile beat their index, as compared to 5% for the lowest expense ratio group.
This data indicates that a high expense ratio presents a challenging hurdle for many mutual funds, especially over longer time horizons. One way to think about this is that mutual funds with high expense ratios have a different starting line—one that is back further because of the drag of high expenses.
This chart illuminates two stark points—active management (including security selection and market timing) has not proven successful, and high costs are a significant drag on performance, relative to the benchmarks that are designed to show if value is being received for the costs of investing.
While costs are an important matter, they are not the only variable to consider among indexes or passive asset class funds. For example, when evaluating index funds within the same general area of a market, like U.S. large cap stocks, a factor to consider that can be more important than cost is, which index is the fund attempting to track? Variation in the holdings of such indexes from provider to provider can vary greatly. Some of the most common indexes in the large cap U.S. markets like the Russell 1000, S&P 500, and Dow Jones Industrial Average are very different. The number of stocks in these indexes range widely from 1000 down to 30, and yet they are often used as the same benchmark. Setting aside all of their other differences, cost alone does not explain the variation in performance across such a wide range of holdings.
When evaluating active management approaches, such as stock picking or market timing, you find that both the total amount of trading and the cost per trade may be high. If a manager trades excessively or inefficiently, costs such as commissions and price impact (bid/ask spreads) can eat away at returns. Excessive trading also can lead to negative tax consequences for a fund, which can increase the cost of ownership for investors holding funds in taxable accounts.
In contrast to highly regimented indexing and high- turnover active strategies, employing a flexible investment approach that reduces the need for immediacy—and thus enables opportunistic execution—is one way to potentially reduce implicit costs. Keeping turnover low, remaining flexible, and transacting only when the potential benefits of a trade outweigh the costs can help keep overall trading costs down and thus reduce the total cost of ownership.
Reducing costs and, more importantly, receiving value for cost are some of the primary reasons that we work closely with firms like Vanguard and Dimensional for the implementation of our portfolios on behalf of clients. Vanguard continues to be the leader in index management and strategy execution while managing their funds at cost with no markup to investors. And while Dimensional is not an index manager and may not be the lowest cost option within any given asset class, their approach to building low-cost solutions that consider all aspects of cost and expected returns into their strategies has resulted in 75% of their funds outperforming their benchmarks over the past 15 years.1
For individual investors, the total cost of ownership of a mutual fund requires a thorough understanding of costs beyond what an expense ratio may tell on its own and therefore can be difficult to assess. For CCM clients, we make sure to look beyond any one cost metric, and instead evaluate the total cost of ownership of an investment solution relative to the expected value that will be received. This is our fiduciary obligation and commitment to you as we manage your portfolio and partner with you to achieve your financial goals.
- Source: Dimensional Fund Advisors (2018). Relative Performance of Flagship Equity Funds [Powerpoint slides]. Available at: https://carlsoncap.com/wp-content/uploads/DFA_Flagship-Equity-Funds.pdf
NOTE: The information provided in this article is intended for clients of Carlson Capital Management. We recommend that individuals consult with a professional adviser familiar with their particular situation for advice concerning specific investment, accounting, tax, and legal matters before taking any action.