
It’s not very often the most exciting asset class during a quarter is cash, but that’s exactly where much of the focus of economists and the financial media fell during the first three months of this year. In fact, throughout 2022 and into the start of 2023, cash has been in the headlines for a variety of reasons. And although the stories themselves vary, the root of each typically stems from actions of the Federal Reserve in their mission to battle against the historically high inflationary environment of the recent past. Even after unprecedented action last year, the Federal Reserve continued their tightening of monetary policy with increases in the federal funds rate in February and March.1 Whether those rate hikes will continue, no one truly knows, but expectations are that they will slow, stop, and then potentially reverse course with rate cuts later in the year.2 The federal funds rate is important for holders of cash because it is closely connected to interest rates paid on short-term treasury bills and by banks and money market funds on deposits. With those rates increasing, savers can receive more return for holding cash than they have since the 2000s.
Last month, during a focused, yet significant banking crisis, cash was in the news for a very different reason. The safety of deposits in regional banks garnered headlines with the closure and FDIC takeover of Silicon Valley Bank, as well as two other technology focused banks. Fears that arose around those takeovers have cooled. Much of the risk appears to have been due to a large concentration of depositors in these banks being technology companies and related venture capital firms, the levels of their deposits above FDIC limits, and the banks’ management of their assets and the impact of the previously mentioned increase of interest rates.
OUR VIEW ON HOLDING CASH
So, what’s the real story with cash as an asset class? Is it an “easy win” with interest rates at levels we haven’t seen for decades, or is holding cash an unseen risk waiting to derail successful financial outcomes? As with most things, we feel the answer falls somewhere in between. We believe that a prudent approach to cash management is a key part of a well-executed financial plan, which acknowledges that, at times, safety is more important than growth; while at the same time, being too conservative may limit your ability to reach your long-term goals.
Holding cash for short-term needs
In finance and economics, cash (in this instance, let’s say it’s a 30-day treasury bill) is referred to as a risk-free asset when it comes to the loss of principal. Looking back over short- and long-term periods, holders of cash have not necessarily had to be worried about volatility or losses in those holdings. The same cannot be said for investors in stocks who, on average, experience negative returns about 25% of the time within a 12-month period.3 The odds are certainly in your favor that stocks will go up in the short-term, but if you happen to experience the one in four times that stocks fell over a 12-month period with capital that was truly needed, will this knowledge bring you solace? It’s for this reason we recommend that clients with known financial needs in the near term don’t attempt to eke out better returns by investing in
stocks with these dollars. It’s typically not worth the risk.
The risk of holding cash when it’s not needed
What about in situations where there is no known need for the assets in the short-term? Perhaps, even so, you’re wondering about locking in the stability of cash at the current high money market fund and short-term treasury bill rates of 4–5% to be deployed later or simply because the risk of loss (in other investments) currently feels too high?4 In these scenarios, the risky side of cash starts to show itself a bit more. As I mentioned earlier, this risk isn’t coming from principal loss, rather it presents itself in the loss of
purchasing power. Historically, even in the short-term, cash is a very ineffective way to grow wealth beyond the eroding effects of inflation.
If we look at a 12-month rolling period of data for returns on cash while adjusting for inflation, a near sure thing for stability turns to only a 57% chance that your dollar will be worth as much next year.5 So where do we turn for protection from this risk? Interestingly, it’s stocks; the exact place we avoided when worried about short-term volatility. For an investor in stocks, the historical track record has been quite favorable to outpace inflation, doing so about 70% of the time.6 Looking longer-term to 10-year periods, cash actually falls in its success rate down to 55% while stocks increase to 87%.7
The risk of holding cash to time the market for more favorable returns
What about a strategy of holding back “dry powder” to be deployed during a future downturn in stocks? Would that be an appropriate use of a large cash holding while still benefiting from current yields? It’s certainly possible that such market timing could work, although the data shows that most investors fail to act when opportunities present themselves.8 A better question in response is whether such tactics are necessary for success?
To demonstrate what I mean, let’s look back at market returns starting on April 1, 2019, through the end of March 2023. The chart below shows 366 three year periods starting with April 1, 2019 to March 31, 2022 through April 1, 2020 to March 31, 2023. Each point on the line represents what the three year return of a US stock portfolio would have been ending on that specific date. This enables us to see how an S&P 500 Total Return portfolio fared through the trials and tribulations of the 33.8% drop at the beginning of the COVID-19 pandemic through the 24.5% declining bear market of 2022 and into 2023.9 By doing so, we can see what the return would have been had you bought stocks on any random day during this period and held them for three years to determine whether market timing is needed for success.
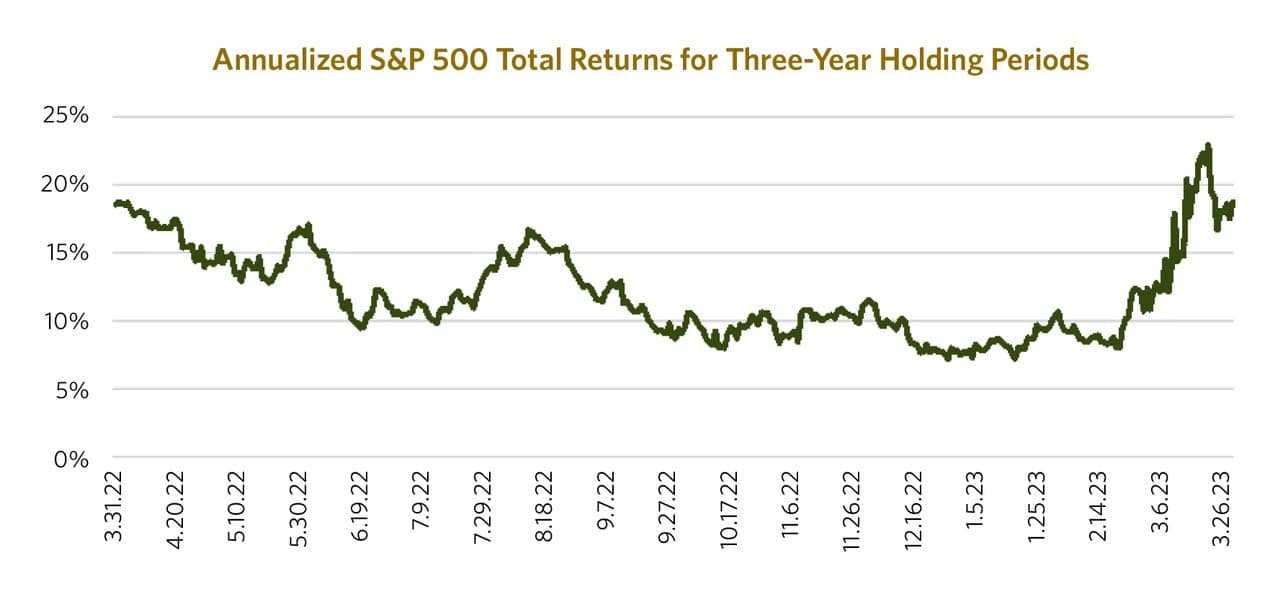
In reviewing the data, whether by skill or dumb luck, it’s clear that timing can matter. But even more importantly, as detailed in the chart above, if your options were to hold cash or pick any day at random to buy stocks, stocks outperformed cash 100% of these three-year holding periods.
THOUGHTFULLY LEVERING CASH POSITIONS
As I mentioned, holding cash is a key component of a well executed financial plan, and a tenet that CCM incorporates in its investment strategy. As long-term investors, we believe that we’ll be rewarded for our investments in the stock market, but our reward requires discipline. Thus, it’s important for a decision to hold cash to be strategic and aligned with your unique needs and financial goals.
Sources for numbers and data cited throughout this summary can be found at:
- https://www.newyorkfed.org/markets/reference-rates/effr
- JP Morgan Guide to the Markets March 31, 2023. Slide 34, https://am.jpmorgan.com/us/en/asset-management/adv/insights/market-insights/guide-to-the-markets/
- Morningstar Direct. IA SBBI US Large Stock TR USD. 1.1.1926–3.31.2023 12 month rolling returns with one month rolling step.
- https://home.treasury.gov/resource-center/data-chart-center/interest-rates/TextView?type=daily_treasury_yield_curve&field_tdr_date_value=2023
- Morningstar Direct. IA SBBI US 30 Day TBill Infl Adj TR USD for the time period of 1.1.1926–3.31.2023, 12-month rolling returns with one month rolling step.
- Morningstar Direct. IA SBBI US Large Stock Infl Adj TR Ext. for the time period of 1.1.1926–3.31.2023, 12-month rolling returns with one month rolling step.
- Morningstar Direct. IA SBBI US Large Stock Infl Adj TR Ext. for the time period of 1.1.1926–3.31.2023, 120-month rolling returns with one month rolling step.
- DALBAR, Inc., 2023 Quantitative Analysis of Investor Behavior Study
- Morningstar Direct. S&P 500 TR.
NOTE: The information provided in this article is intended for clients of Carlson Capital Management. We recommend that individuals consult with a professional adviser familiar with their particular situation for advice concerning specific investment, accounting, tax, and legal matters before taking any action.