
As investors, every single one of us is prone to a range of emotions during periods of market volatility: fear, anxiety, optimism, greed, regret, and more. We’re not alone in this experience; there are millions of investors going through these same emotions with us each and every day. The incredible reality of the market is that no one precisely knows what the future holds, when the stock market will bottom out, or what the ultimate economic and human impact will be of the COVID-19 pandemic.
Volatility's Impact on Equity Investors
Over short periods, the market will fluctuate with the daily sentiment of crowds and the continual flow of new information; over the long run, markets are completely emotionless "weighing machines," as Benjamin Graham would say. With the substantial increase in volatility and market movement over the past month, we’d like to take a step back and provide context on where markets currently sit from a valuation perspective and what that means for disciplined long-term investors. As we will show, from a historical perspective, the future prospects for equity investors are encouraging at these valuation levels. This is not to make light of the significant downturn, but to look forward in terms of what one might expect after this type of market disturbance.
Market History
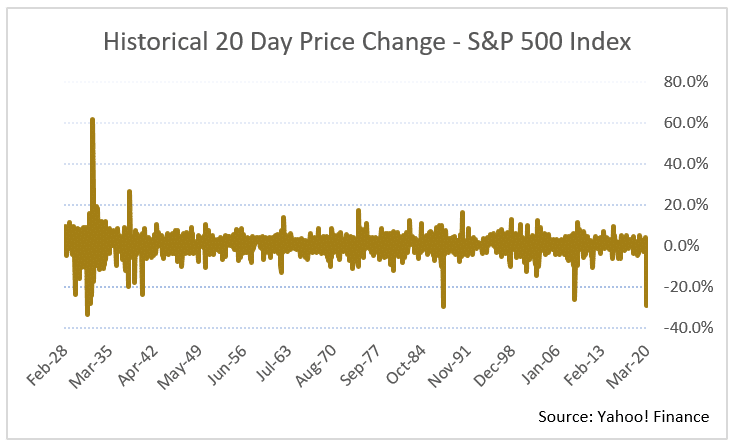
The S&P 500 reached an all-time high of 3,386 on February 19, 2020. At the close on Wednesday, March 18, 2020, the S&P 500 sat at 2,398, a decline of 29.2% over the course of 20 trading sessions. 1 This level of volatility is abnormal, but not unprecedented. Before we dive into the current prospects for investors, we thought it would be worthwhile to share a bit of perspective on market history.
The U.S. stock market has witnessed a similar level of volatility over this short of a time frame in three prior periods: November 1929, October 1931, and October 1987. Interestingly, while the heightened volatility in 1929 and 1931 occurred at the start of the Great Depression, the volatility in 1987 did not even produce a mild recession.
What can we learn from these periods that might help us place our current environment into better context?
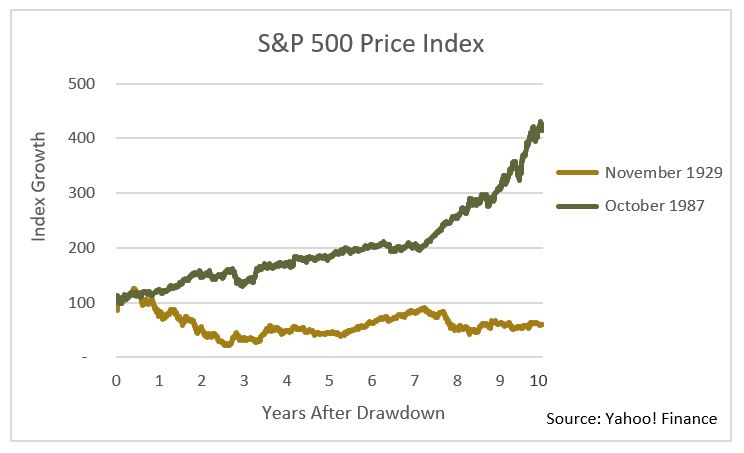
The Great Depression occurred as a result of widespread bank failures and ineffective global trade policies. This, in turn, produced significant reductions in consumer spending, resulting in a 25% unemployment rate. The S&P 500 peaked at 31.86 in September 1929 and wouldn’t reach new highs until September 1954, a full 25 years later. Even after the significant early volatility in November 1929, investors in the S&P 500 would experience an annual return of -1% per year, for 10 years. 2
In the 1987 case study, the S&P 500 had already made new all-time highs by July 1989, less than two years after the infamous Black Monday market crash of 1987. Ten-year annual returns after the large losses in 1987 were slightly above 17% per year.
The Impact of Valuation
Why did investors have such different experiences after these periods of strong market selloffs? A major contributor to this difference in outcomes for investors is valuation.
Investors at the start of the Great Depression had bid up the prices of stocks so high that future returns were already set to be well below average, even without a depression. Investors in 1987 did not face the same hurdle. In 1929, before the market started to decline, investors were paying 30x historical 10-year earnings, more than double what they had been willing to pay on average over the prior 50 years. S&P 500 valuations would not reach such extraordinary heights again until the late 1990s.
In 1987, ahead of Black Monday, the S&P 500 was selling for 18x historical 10-year earnings, a significantly more reasonable valuation. As a result, after the brief period of market volatility, the stock market was quickly viewed as undervalued, and investors raced in to take advantage.
Where We Are Today
So where do we sit today in terms of valuation relative to history? It matters enormously where the level of interest rates are relative to expected equity returns, valuation, and the alternatives for investment.
Carlson Capital Management's method of interpreting stock market valuation relies on understanding both the expected return of equity markets, as well as the environment in which those returns are achieved. Projecting an 8% future return has significantly different implications if Treasury notes are yielding 2% or 10%. In the former, equities are very attractive, while in the latter, equities are offering unattractive returns. Therefore, we believe returns are best contextualized in terms of the equity risk premium, which is simply the return that equity markets deliver above safe government Treasury notes.
Ahead of the market downturn in February 2020, the U.S. stock market was projecting to deliver an equity premium of 2.8% per year for the next 10 years. (The product of projected future 10-year equity returns of 4.3% and a five-year Treasury yield of 1.5%.) This may strike you as an extremely low number, but the 50-year average equity premium for U.S. equities has been 5.0% per year. To put these numbers in perspective, the anticipated 10-year equity risk premium for U.S. equities has ranged from as low as -9.0% in early 2000, to as high as 14.4% in March of 2009. Ultimately, a 2.8% equity premium is below average, a result of slightly elevated valuations, but still attractive relative to fixed income markets and other alternative investments. It should be noted as well that this projection is for a broad basket of U.S. equities, and does not account for the additional return expected by investors who have portfolios constructed to capture the value, size, profitability, and investment premiums within equity markets. 3
As of the market close on this past Wednesday, the U.S. stock market has a future projected 10-year average annual return of 9.7%. Using the current yield of 0.7% on five year Treasury notes, this gives us a projected 10 year equity premium of 9.0%, significantly above our 50-year average.
We know that markets are pricing in current economic data, as well as expectations for the future, such as the historic expected rise of unemployment claims starting next week. If we project forward one year and make the extremely conservative assumption that earnings will fall 40% like they did in the Global Financial Crisis of 2008, we find that current equity valuations are still 20% below expectations based on long-term averages.
What We Know
Investors are currently trying to process a significant volume of new information into market prices. The added stress of the human aspect of this crisis only magnifies the range of emotions that individuals are experiencing during this time period. We don’t believe that any investor currently possesses enough information to confidently project a clear path forward, but we do know that markets ultimately filter through the unique circumstances of any crisis and focus on the long-term earnings potential. We share this analysis with you because we believe that markets are better positioned from a valuation perspective to see their way through this crisis and deliver solid long-term returns. This, unfortunately, provides limited comfort for the short-term market fluctuations that we’ll undoubtedly continue to experience over the next several months. However, we want to keep a long-term perspective and make sound decisions based on time-tested wisdom and logic.
The exposure of your portfolio to equity markets is a strategic one, designed with both your risk tolerance and financial goals in mind. CCM's investment team is ensuring your portfolio remains in alignment with that strategic decision by proactively rebalancing your portfolio, in recent weeks selling fixed income to purchase equities for many client portfolios. Volatility may be unnerving, but we believe investors will be well rewarded for this disciplined approach over the coming years.
- Yahoo! Finance, S&P 500 Price Index
- Dimensional Returns Web
- The methodology of projecting 10 year equity returns is based on Jeremy Siegel’s 2016 paper The Shiller CAPE Ratio: A New Look, published in the Financial Analysts Journal.
The information above does not represent a recommendation of any particular security, strategy or investment product. The opinion of the author is subject to change without notice. Information contained herein has been obtained from sources believed to be reliable, but is not guaranteed. This article is distributed for educational purposes and should not be considered investment advice or an offer of any security for sale. Past performance is not indicative of future results and no representation is made that the stated results will be replicated.