
In conversations with our clients, we often talk about investment premiums, which are characteristics of companies whose stocks have historically outperformed. The three premiums we discuss most often are size, valuation, and profitability. In short, companies that are smaller in size, have low valuations, and have high profitability, have historically outperformed. In this article we’ll be specifically focusing in on the size premium.
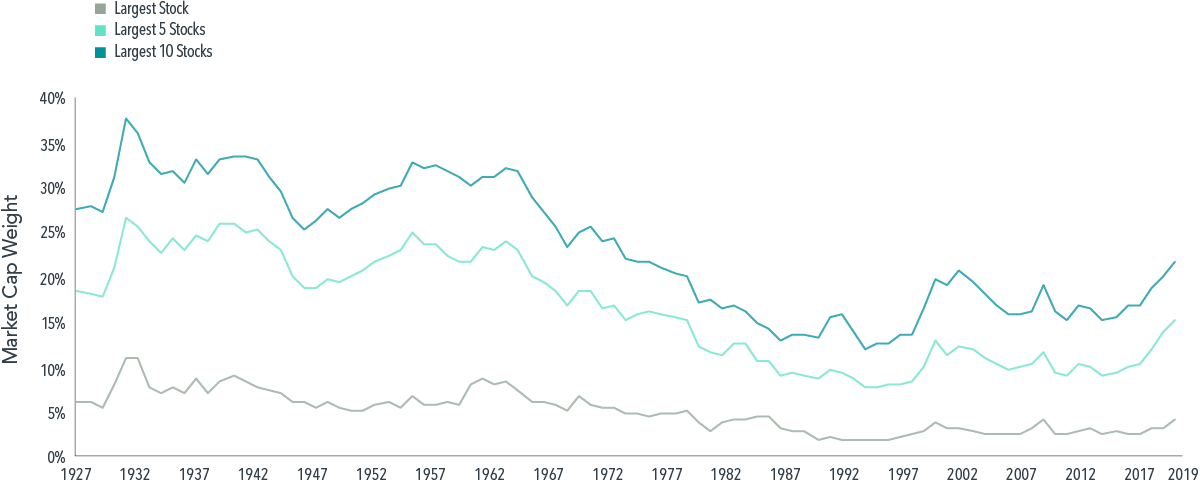
Looking back over nearly a century of market history is extremely useful, but investors often want to connect that history to the unique circumstances of markets today. One dynamic that has captured market headlines in recent years is the growing influence of some of the largest U.S. companies, such as Apple, Microsoft, Google, Amazon, and Facebook. As shown in the exhibit below, the strong stock performance of these market heavyweights has led them to account for an increasing proportion of the overall stock market capitalization in the United States.
Weight of largest stocks by market capitalization in U.S. stock market, 1927–2019
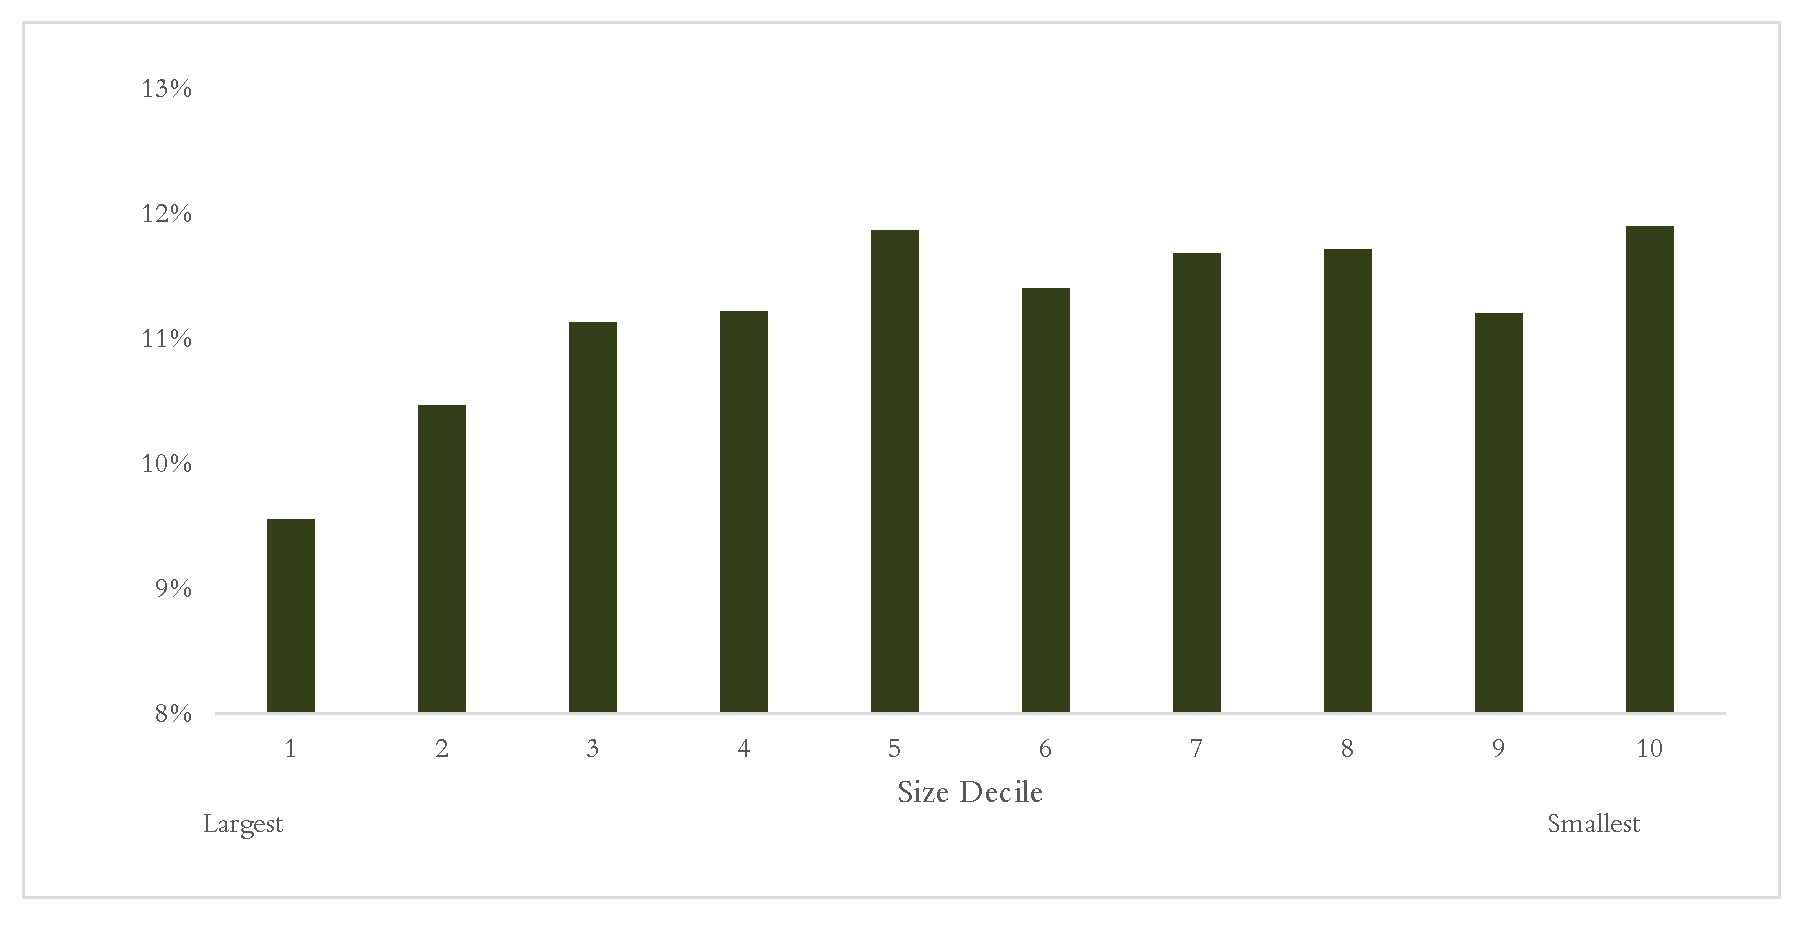
While investors have been rewarded in recent years for investing in these name brands, it's important to understand that this dynamic is more of the exception than the rule. The graph below outlines the historical returns for the U.S. stock market, divided into deciles based on the company’s size (market capitalization). Decile 1 shows the historical average annual return for the top 10% of market capitalization stocks (large), whereas Decile 10 shows the historical average annual return for the bottom 10% of market capitalization stocks (small). Historically, that largest decile of stocks has underperformed the broader market by roughly 1.5% per year. While the largest companies have bucked that trend in recent years, we know that there are limitations to how large these companies can grow, and history tells us we’re unlikely to see this continue for long.
Historical Annual Returns - CRSP Deciles (1926–2020)
NOTE: The information provided in this article is intended for clients of Carlson Capital Management. We recommend that individuals consult with a professional adviser familiar with their particular situation for advice concerning specific investment, accounting, tax, and legal matters before taking any action.