
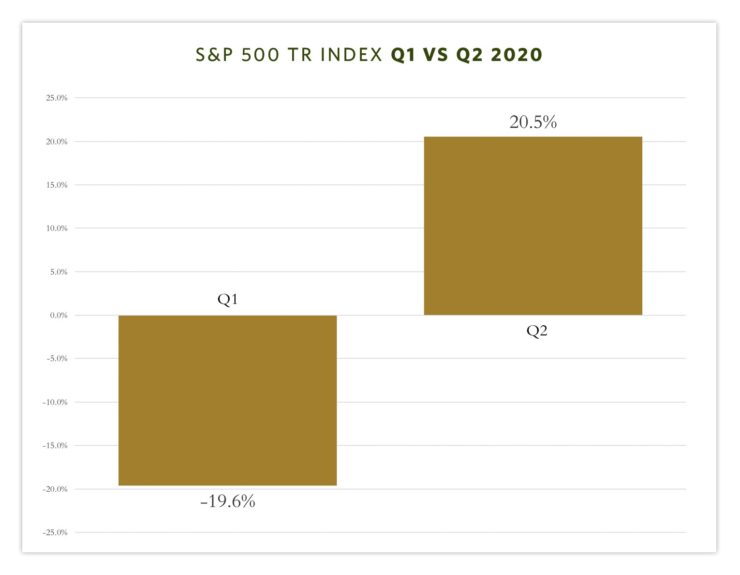
As the chart below shows, 2020’s second-quarter rise in equity market performance was as dramatic as the previous quarter’s decline. With plenty of bumps along the way, the S&P 500 is now up more than 40% from the bottom on March 23. 1 If we view these recent extreme market events as isolated time periods, we can see the sharp contrast between the first two quarters of 2020 (Chart 1, below). These quarters were truly “tail events.” Q1 produced the fifth worst return, and Q2 produced the fourth best return of calendar quarters over the past 80 years. 2 This likely isn’t surprising given the unprecedented events we’re experiencing in the world today.
The Bigger Picture
When we step back and isolate these points in time, it underscores why it was such an uneasy experience for investors. It’s natural and helpful to look at stock market return data within the confines of specific time periods, whether it’s calendar months, quarters, or years. That data helps us see time-specific market realities, while also giving us the ability to view the bigger picture and getting us beyond the noise of daily movements. It’s important to remember that even an annual return is just one number and doesn’t capture the breadth of experiences and emotions that the year contained. A number alone cannot convey how the actual volatility “felt” at the time.
When we extend this kind of data out over a 40-year-time-period we gain additional critical context. The chart below illustrates calendar year returns and intra-year declines for the S&P 500 since 1980. By just looking at the individual years, it’s hard to see the compounding growth that investing in stocks has provided. Each dollar invested at the beginning of 1980 is worth more than $84 at the end of June 2020. 3 That sounds great, but it wasn’t always easy to weather the storms along the way. Looking more narrowly at the calendar year bars, 30 out of the 40 years ended up providing positive returns—that is, 75% of the time, investors were rewarded for being in the markets. Interestingly, however, in this same period, almost 75% of the time, markets were down 10% or greater from the highs of the specific year, and, in fact, 40% of the time they were down 15% or greater. Certainly, these kinds of roller-coaster experiences are more common than we might recall.
Lessons From Equity Market Performance
When you note 2020’s combination of unremarkable year-to-date returns, and extreme intra-year loss, you’ll observe that there are other years with similar market experiences. Like this year, these other periods represent extreme and unprecedented events such as wars, global credit crises, 9/11, the tech bubble bursting, the crash of 1987, the global financial crisis, and many more. Hopefully, these illustrations underscore some key points as we continue to navigate a global pandemic. Many things in our lives and society feel, and remain, uncertain.
When it comes to equity markets, we are reminded by looking at historic performance that, 1) Markets can change rapidly and dramatically—volatility is, has been, and always will be part of the experience, 2) Higher returns have historically been the reward for accepting risk and volatility, and 3) 40 years of market history underscores what has been magnified by our experience during the pandemic—you simply can’t time the markets. Where these snapshots in time are perhaps most beneficial, is to reinforce how to behave in the future—with patience and discipline.

- Morningstar, S&P 500 TR for the time period of March 23-July 8, 2020
- Dimensional Fund Advisors, S&P 500 TR
- S&P 500 TR for the time period of January 1, 1980-June 30, 2020
The information above does not represent a recommendation of any particular security, strategy or investment product. The opinion of the author is subject to change without notice. Information contained herein has been obtained from sources believed to be reliable, but is not guaranteed. This article is distributed for educational purposes and should not be considered investment advice or an offer of any security for sale. Past performance is not indicative of future results and no representation is made that the stated results will be replicated.